
This guide will help you to open the browser error console to troubleshoot a problem.
When troubleshooting issues with All in One SEO, as well as other plugins and themes, it's sometimes useful to check for errors in your browser. This is especially important because a lot of code runs in your browser and affects whether, or how, a page is displayed.
There are three way to open the browser error console depending on your operating system and browser. These are:
- In Windows, press the Control, Shift and I keys, or on Mac, press the Command, Option and I keys on your keyboard at the same time.
- Press F12, or Function and F12, on your keyboard.
- Right-click anywhere on the page in your browser and choose Inspect or Inspect Element from the popup menu
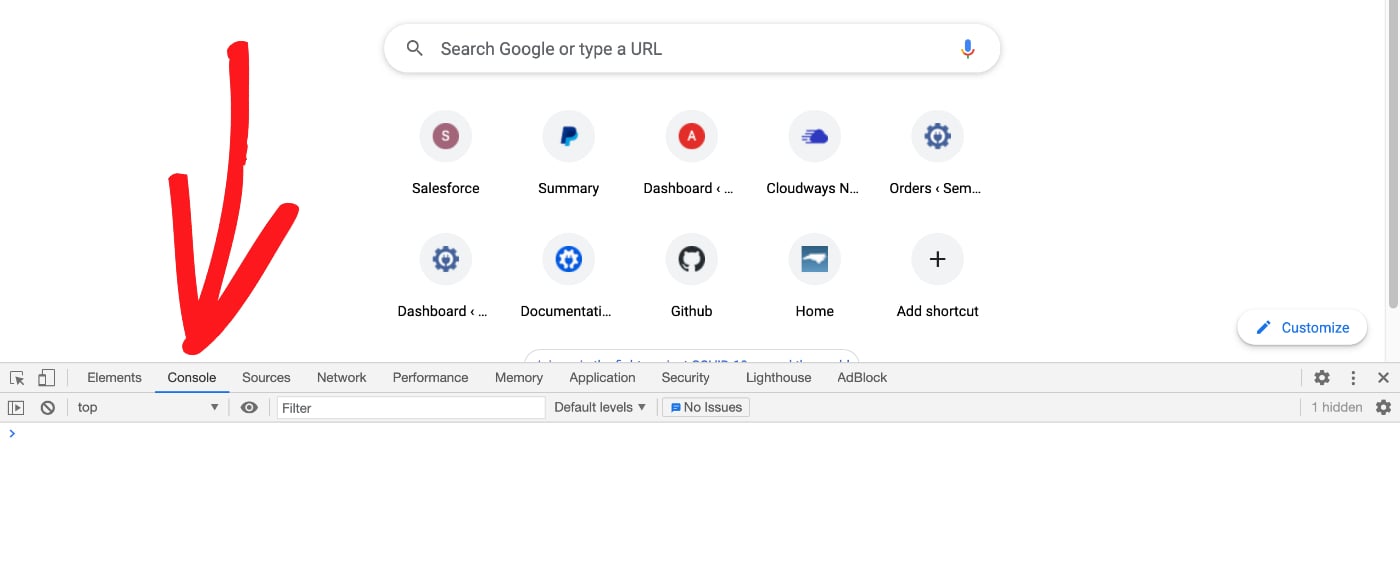
When you use the methods above, a panel will be displayed at the bottom of the browser.
At the top of this panel will be some tabs, click on the tab called Console. Here's how this looks in Chrome.
Finally, reload the page in your browser by clicking the Reload icon in the button bar, or by pressing Control, Shift and R in Windows or Command, Shift and R on Mac, and any errors will appear in red in the browser error console.
These may give you some idea of the problem or help us if we're troubleshooting with you.