
Do you want an easy way to see how your content is doing on Google?
If you do, then our Search Statistics reports will help you understand which content is doing well and which is not.
Here we'll provide an introduction to the features in Search Statistics.
In This Article
IMPORTANT:
Before getting started, make sure to connect Search Statistics to your Google Search Console account.
You can find instructions on how to connect to your Google Search Console account here.
NOTE:
The Search Statistics feature is available to customers with an Elite plan for All in One SEO Pro.
Upgrade to All in One SEO Pro today to get Search Statistics and many more features!
Tutorial Video
Check out our video on Search Statistics here:
Search Statistics Dashboard
The Search Statistics Dashboard provides a central location where you can find an overview of how your content is doing on Google.
To view the Dashboard, click on Search Statistics in the All in One SEO menu.

On the Dashboard, you'll see overviews of the SEO Statistics, Keyword Positions, Keyword Rankings, and Content Performance. There's also the Post Optimizations widget which also appears on the WordPress Dashboard and the All in One SEO Dashboard. Each of these are discussed below.

You'll also see a date range selector in the top right corner of the Dashboard where you can select the date range you want to see statistics for.

The date range will default to the previous seven days from yesterday. Click on the date range to change it. This will update all of the reports in Search Statistics.

NOTE:
Search Statistics will not show statistics for the current day because statistics are still being recorded by Google Search Console.
SEO Statistics Widget
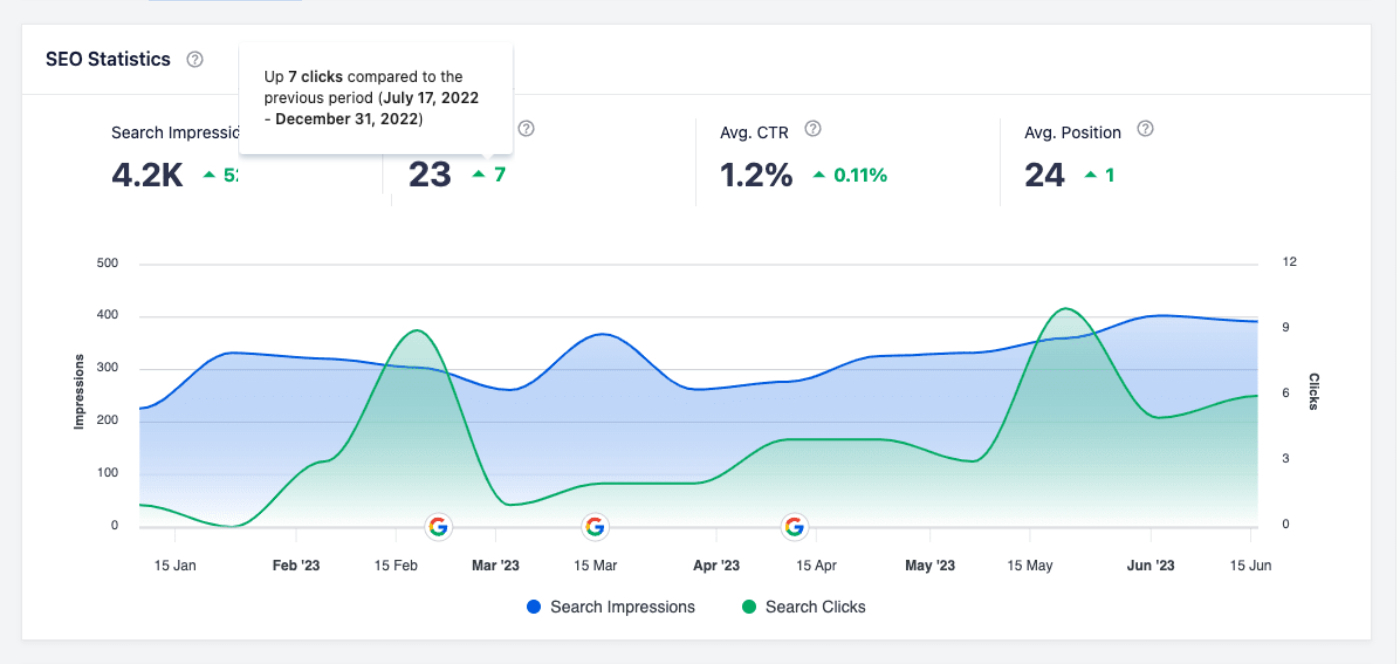
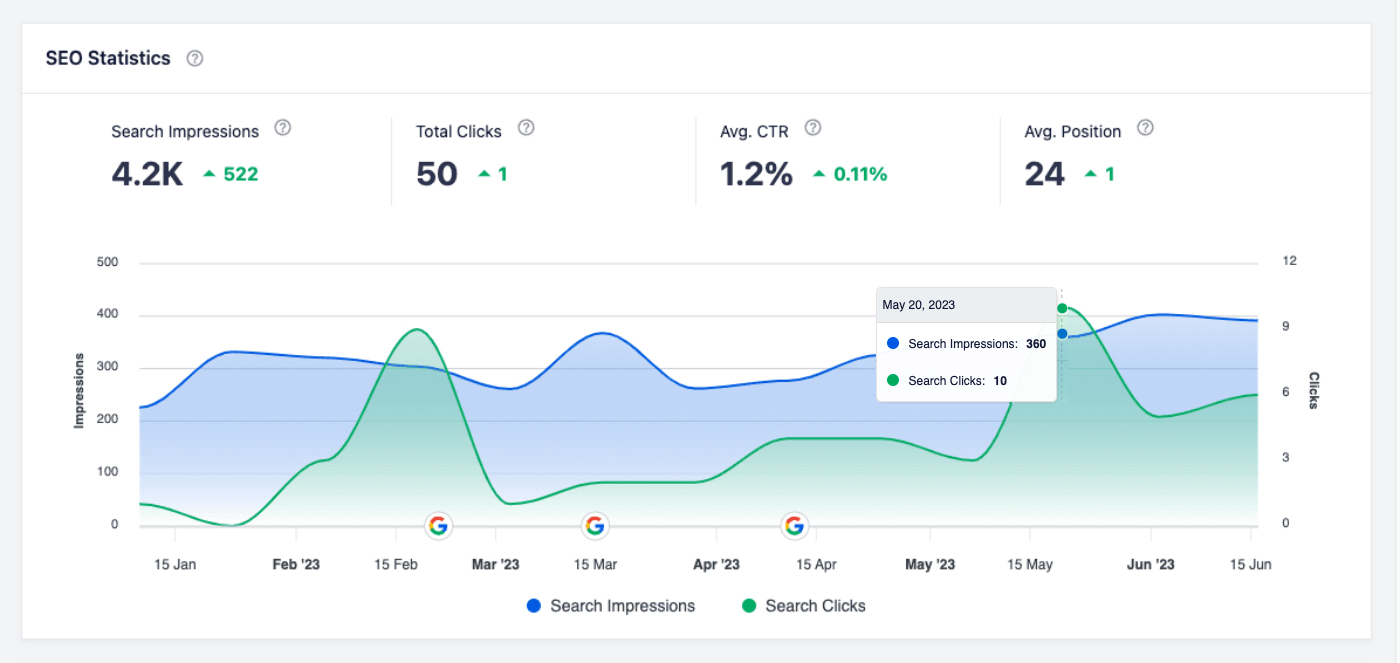
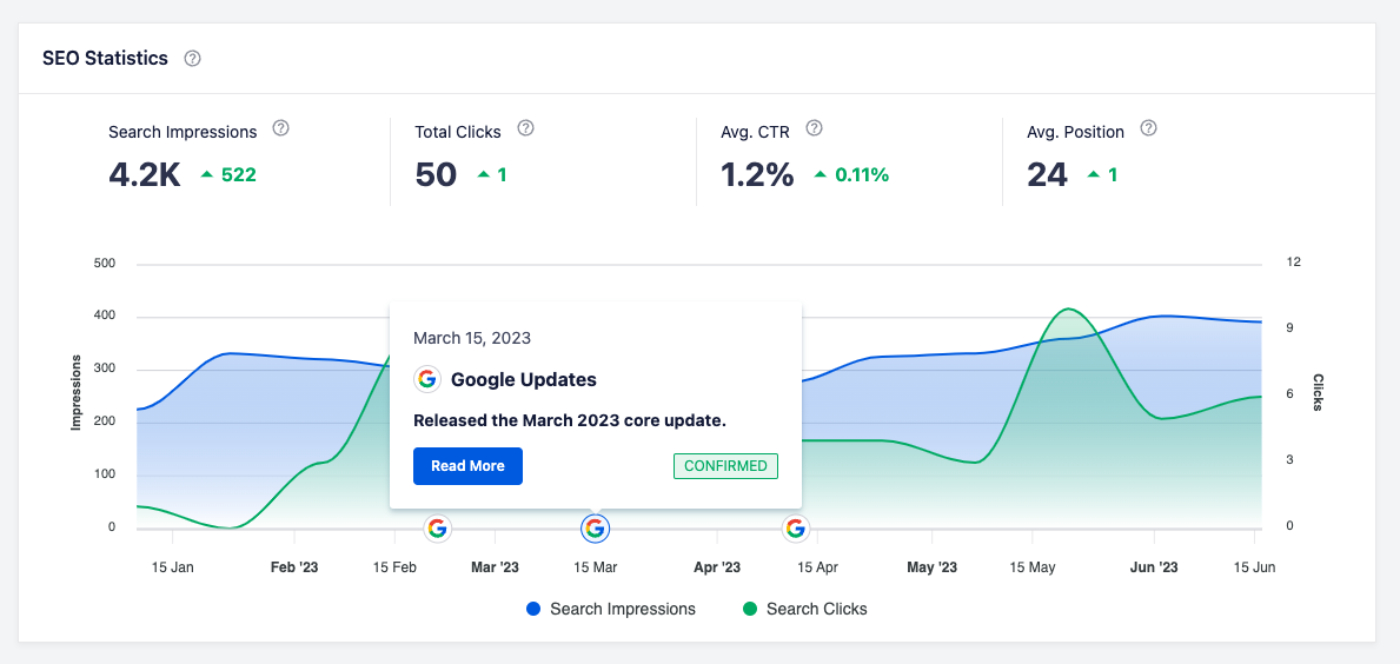
This widget shows an overview of the Search Impressions, Total Clicks, Average Click Through Rate (CTR), and Average Position for all content on your site for the date range set.
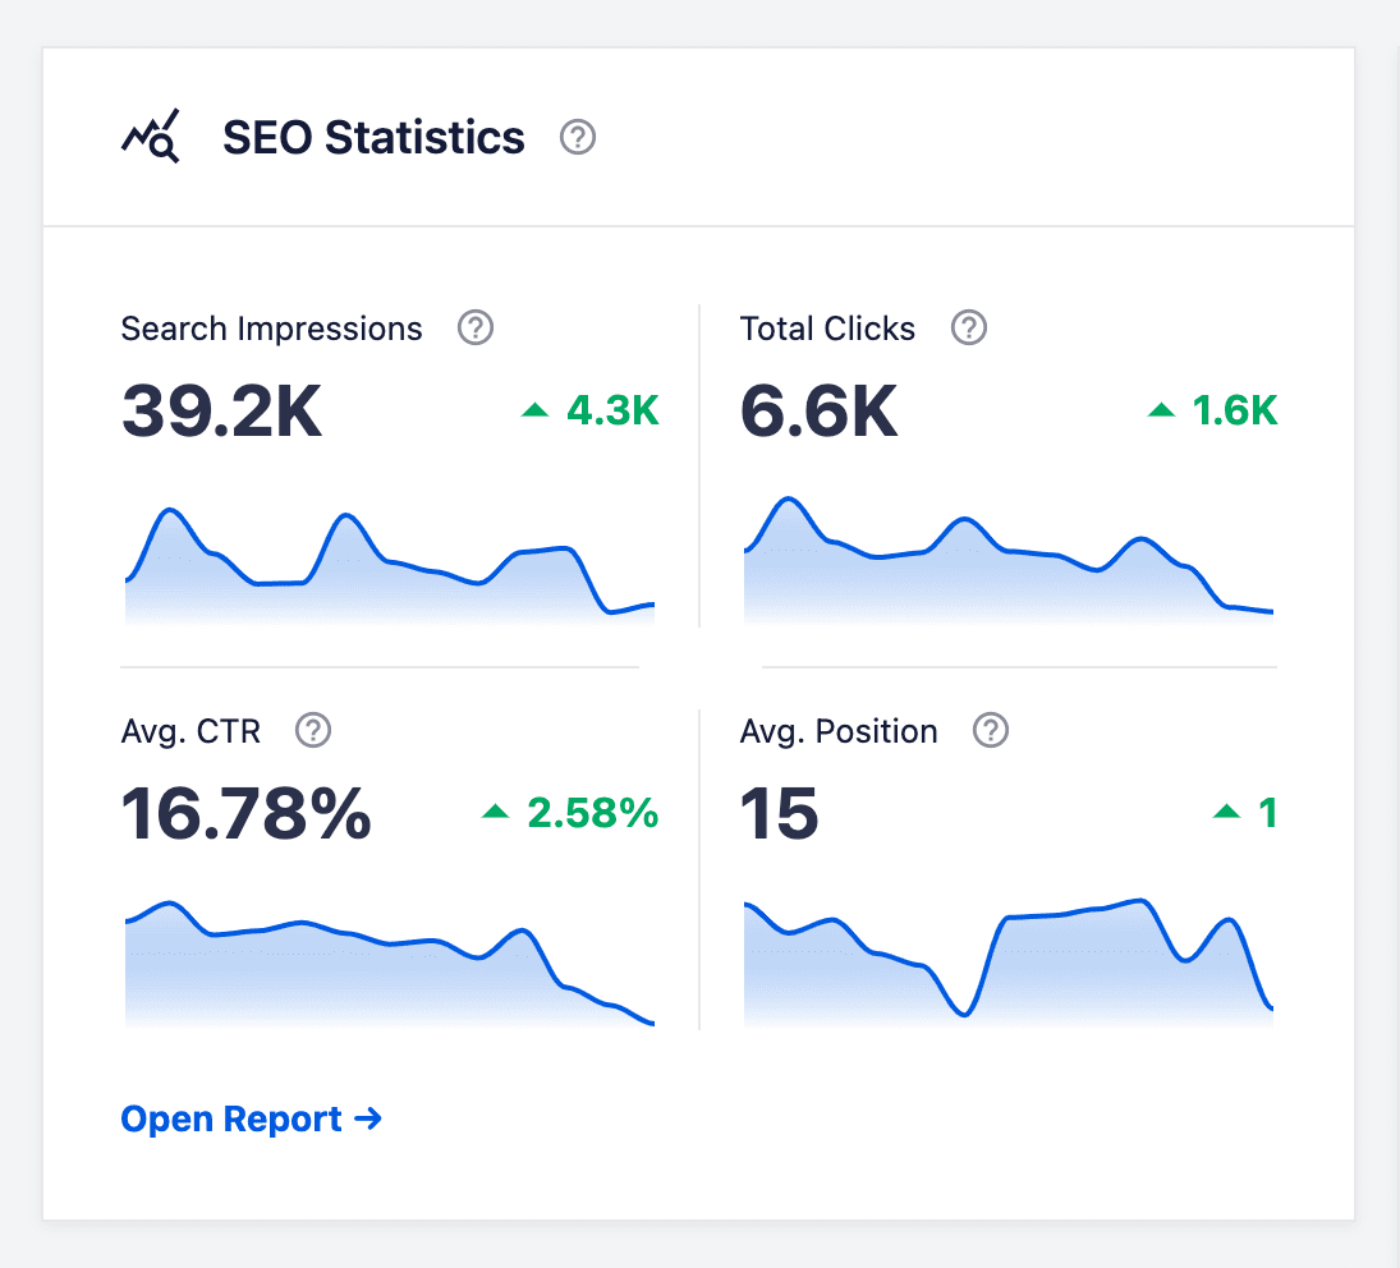
The statistics here are gathered from the Performance report in Google Search Console.
- Search Impressions is how many times a user saw a link to your site in Google search results.
- Total Clicks is how many times a user clicked through to your site from Google search results.
- Average CTR is the percentage of impressions that resulted in a click.
- Average Position is the average position of your site in Google search results, based on its highest position whenever it appeared in a search.
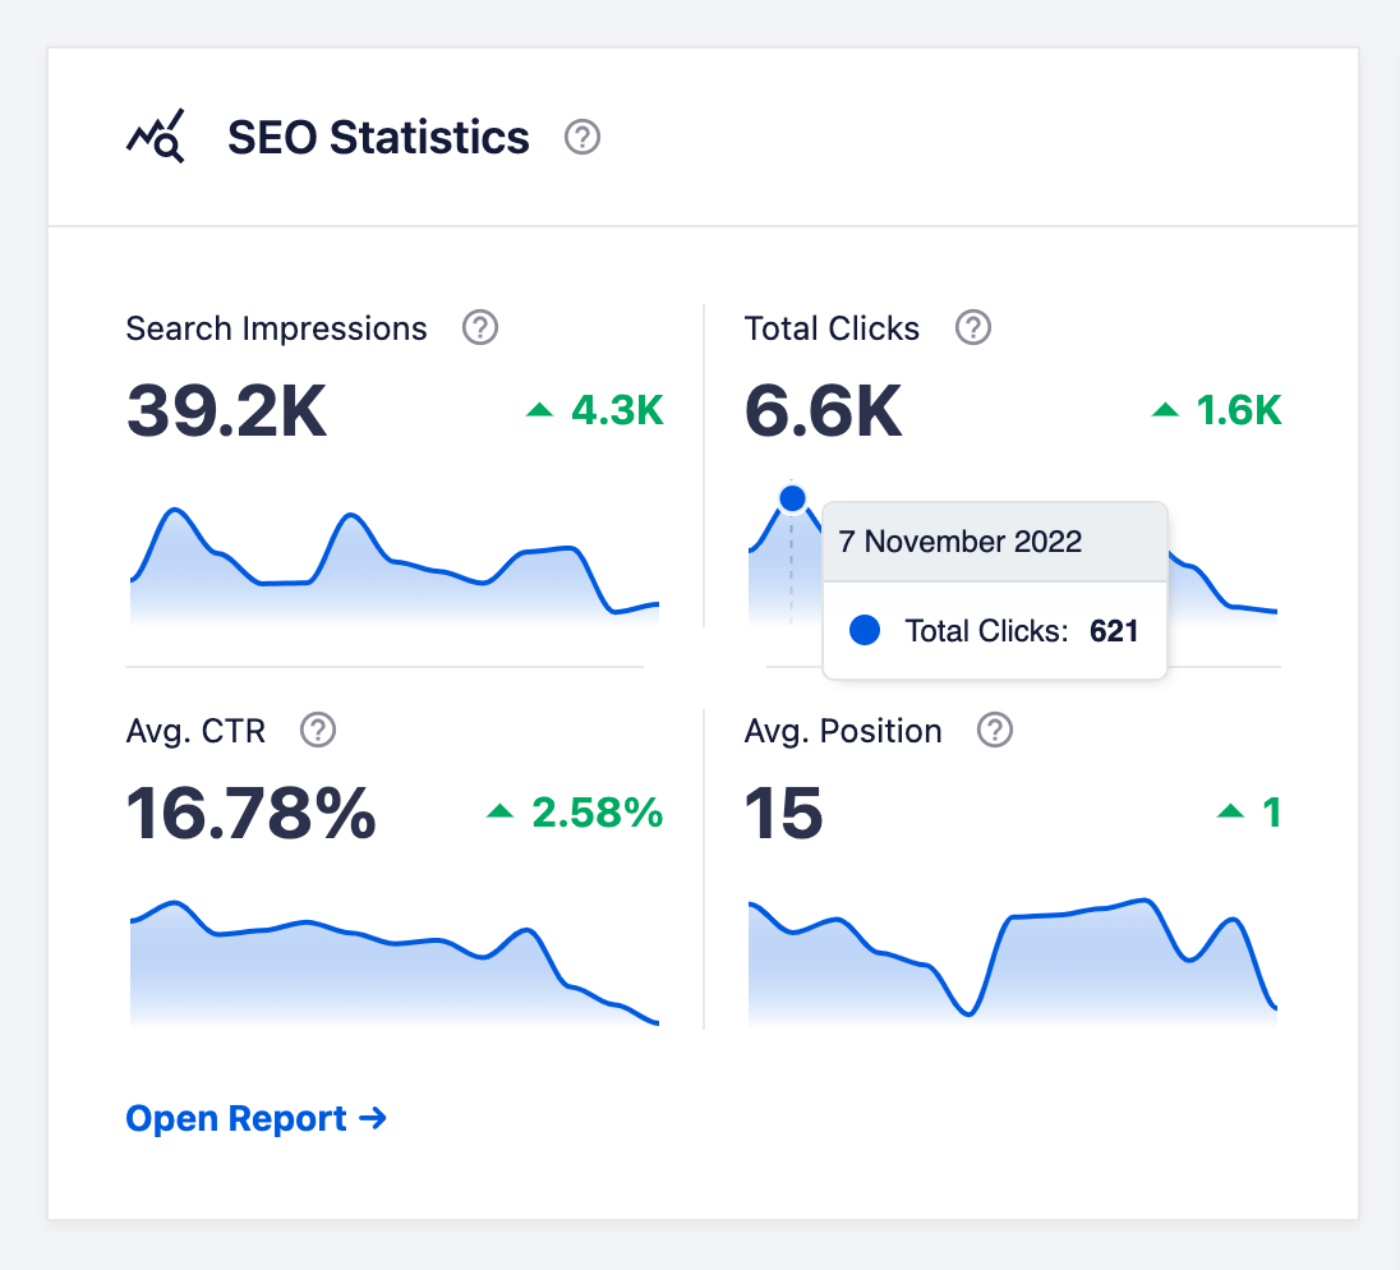
You can mouse over the graph to see details over time.
Click on the Open Report link to go to the full report on the SEO Statistics tab.
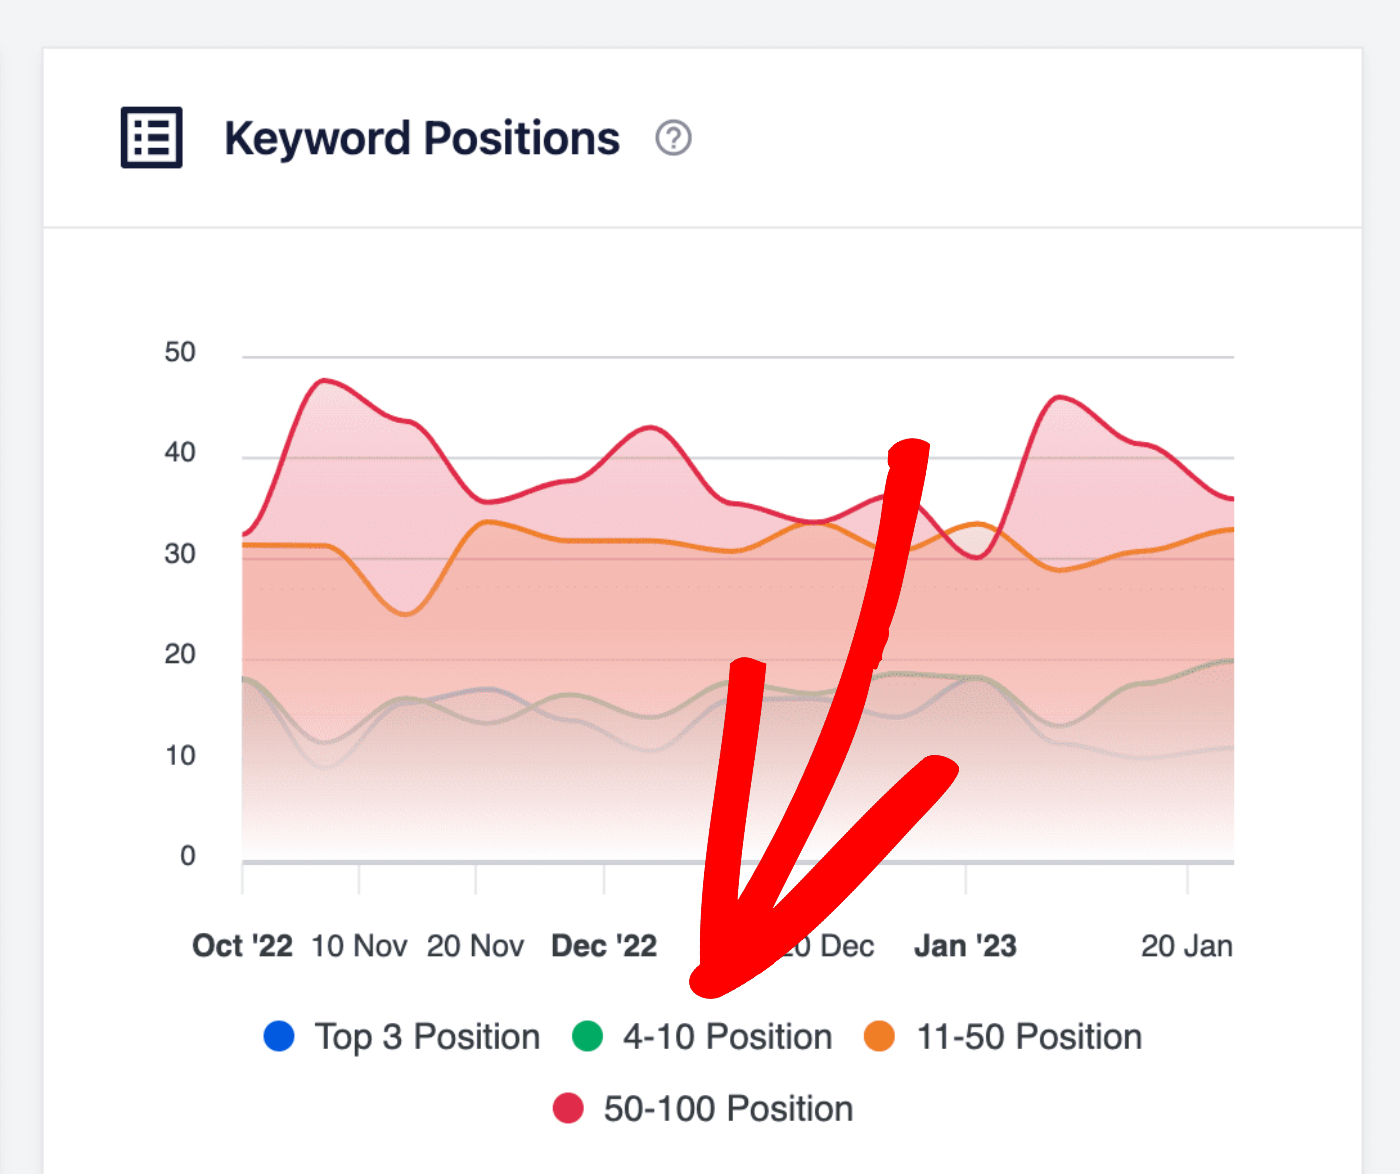
Keyword Positions Widget
This widget shows the average position of your keywords in Google search results for the date range set.
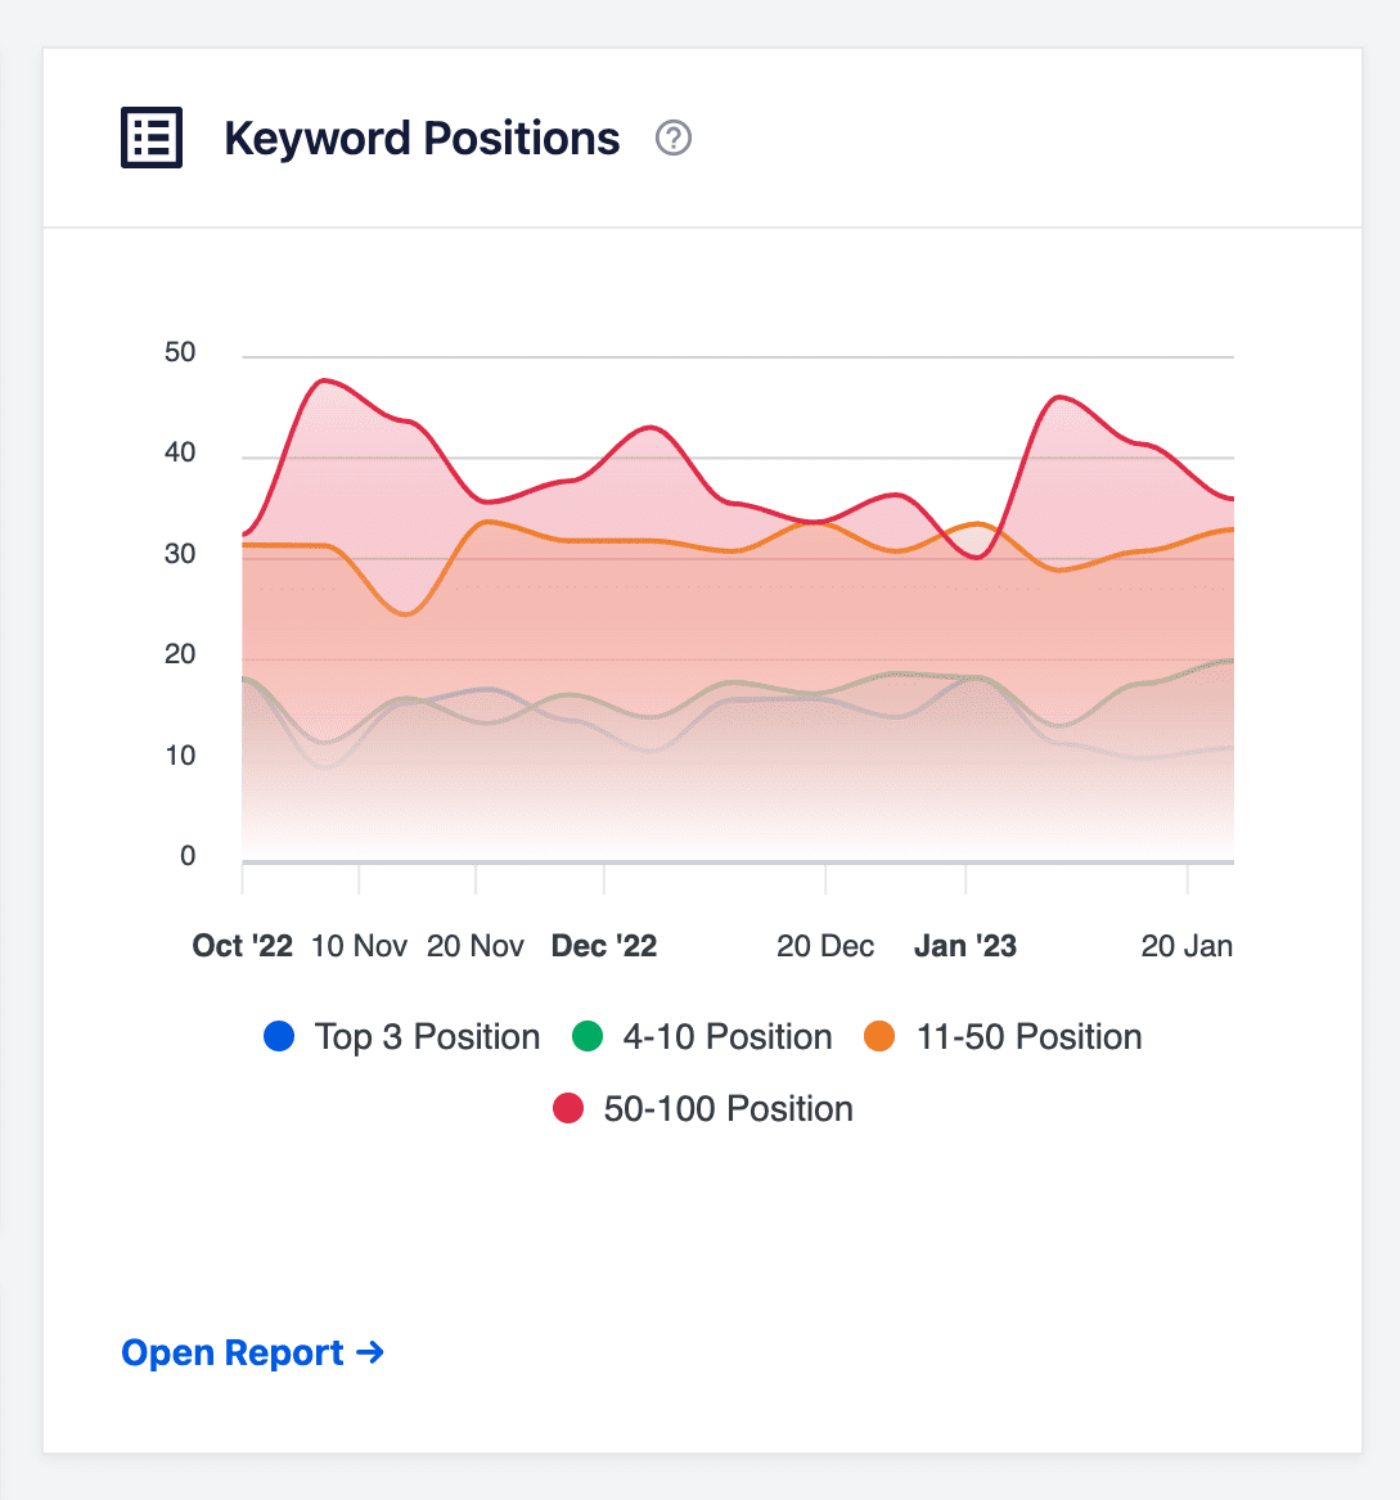
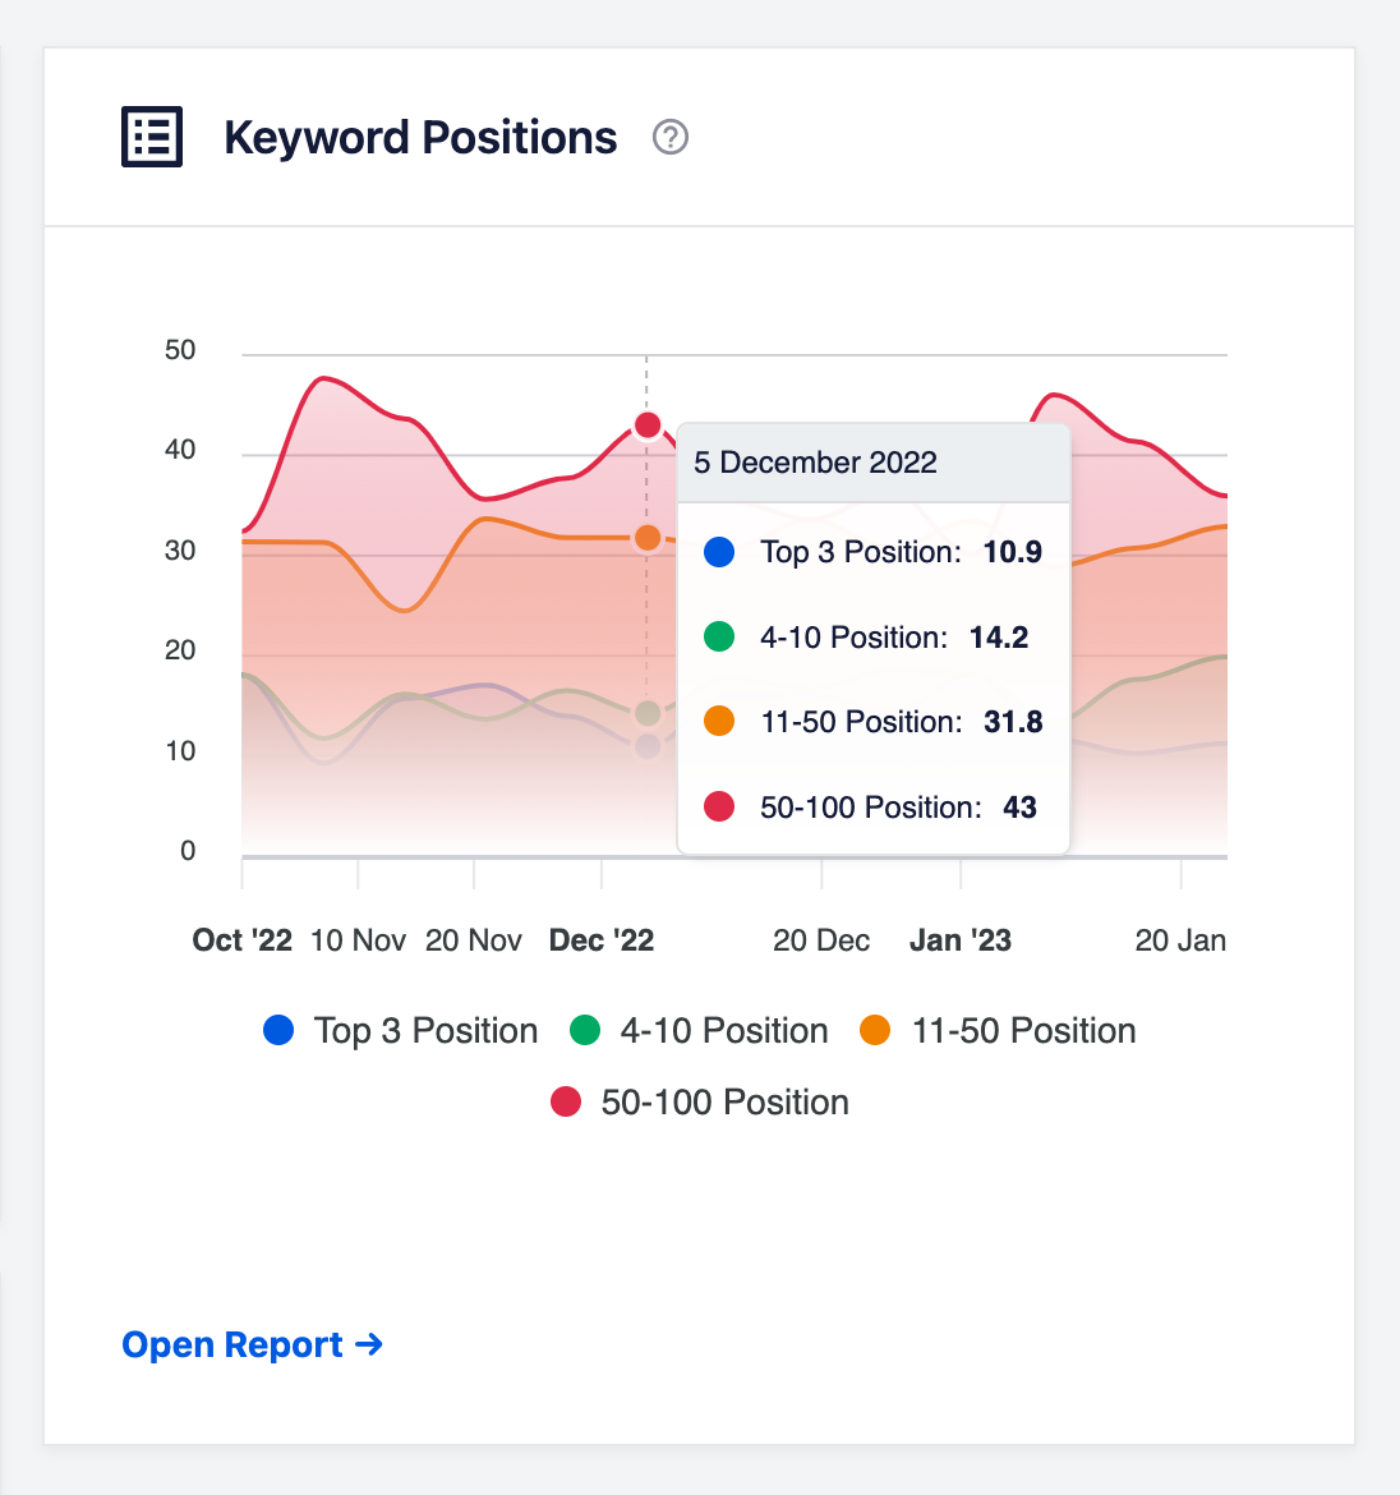
You can mouse over the graph to see details of the position of your keywords in increments as shown below.
You can click on the graph legend items (shown below) to remove that range from the graph. Click on the graph legend items again to add that range back to the graph.
Click on the Open Report link to go to the full report on the Keyword Rankings tab.
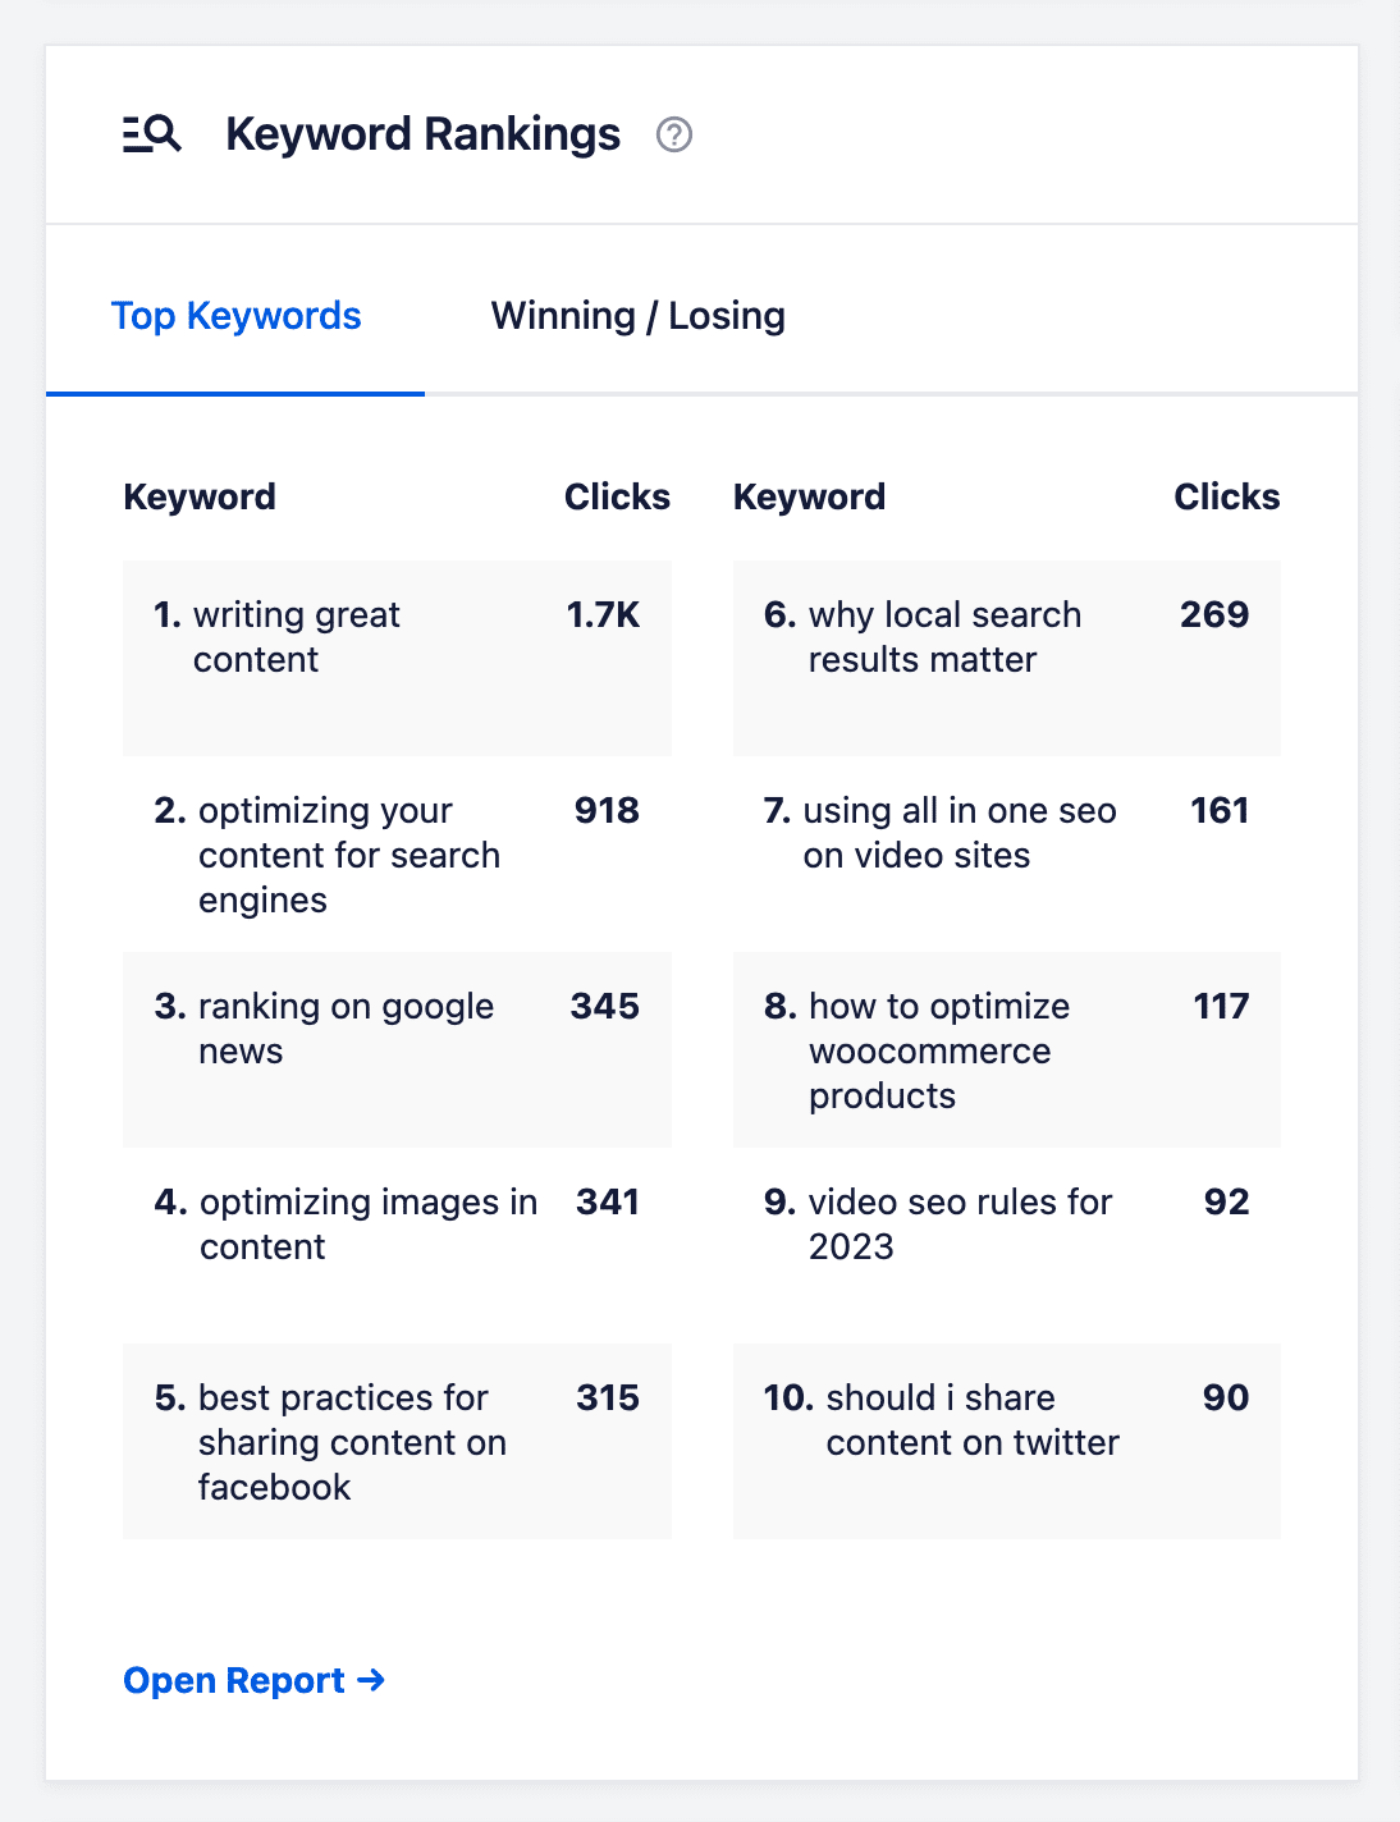
Keyword Rankings Widget
This widget shows the Top Keywords and Winning / Losing which are the search terms that have seen the biggest changes of position in Google search results for the date range set.
On the Winning / Losing tab, you can mouse over the green or red number to see a description of the change in position as shown below.
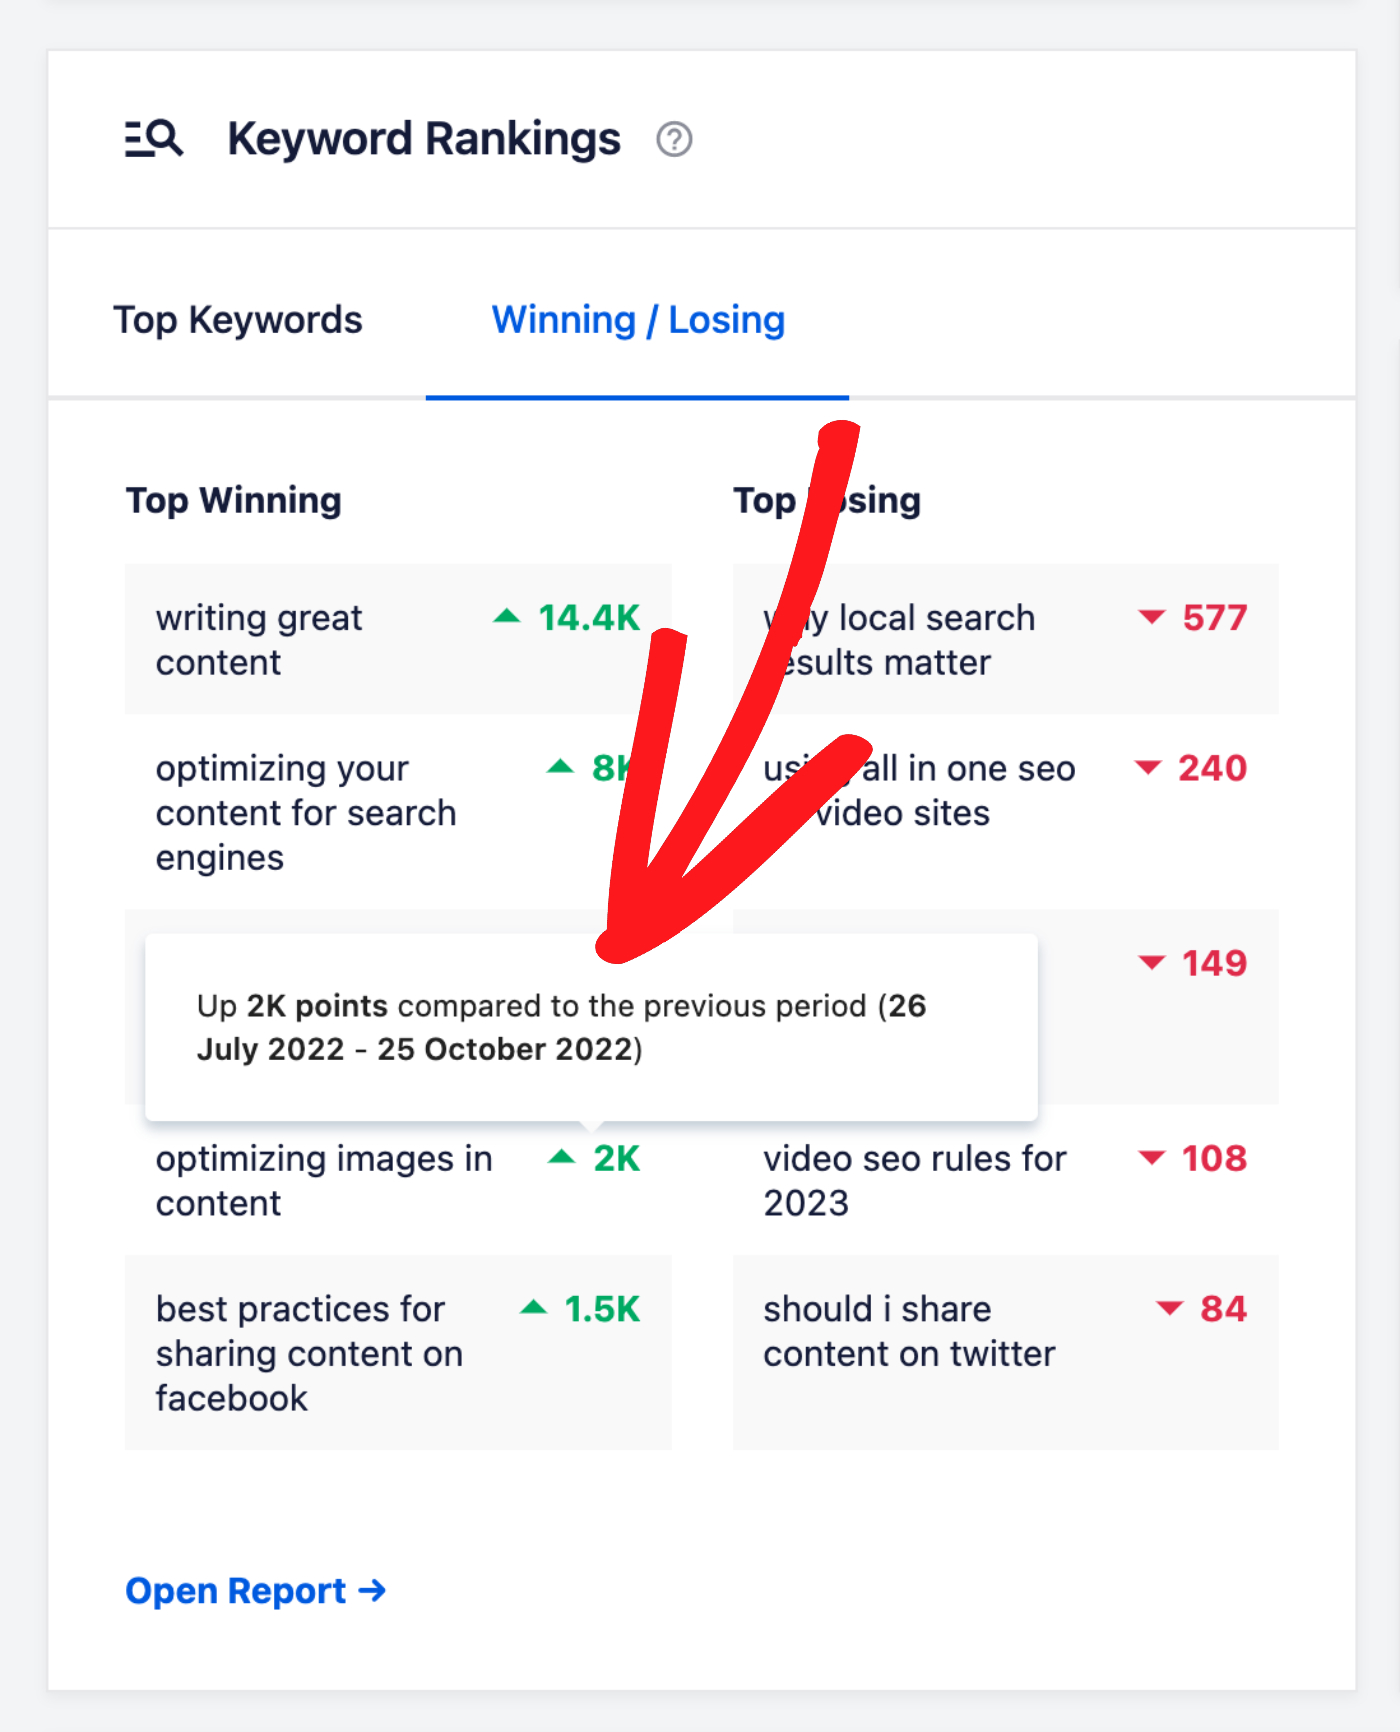
Click on the Open Report link to go to the full report on the Keyword Rankings tab.
Post Optimizations Widget
This is the same as the AIOSEO Overview widget that is displayed on the WordPress Dashboard and the All in One SEO Dashboard.
You can learn about this widget in our Dashboard Widgets article here.
Content Performance Widget
This widget shows a detailed report of the Top Pages, Top Losing, and Top Winning which is the content on your site that has seen the biggest changes of position in Google search results for the date range set.
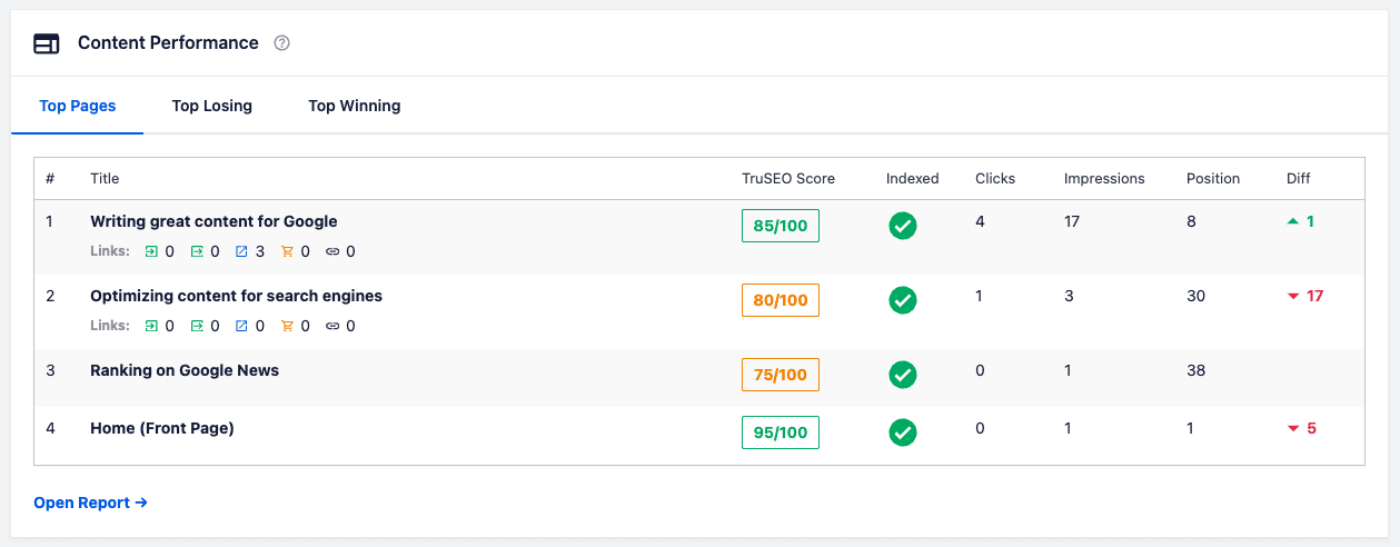
The Top Pages tab shows the content that received the most clicks.
The Top Losing tab shows the content that saw the biggest negative ranking change in Google during the period set.
The Top Winning tab shows the content that saw the biggest positive ranking change in Google during the period set.
In these reports, you can see the following information:
- Title – This is the title of your content.
- TruSEO Score – This is the TruSEO score for your content.
- Indexed – This shows the index status in Google. You can learn about this feature in our Index Status article here.
- Clicks – How many times a user clicked through to your content from Google search results.
- Impressions – How many times a user saw a link to your content in Google search results.
- Position – The average position of your content in Google search results, based on its highest position whenever it appeared in a search.
- Difference – This shows the change in position of your content in Google search results for the period set.
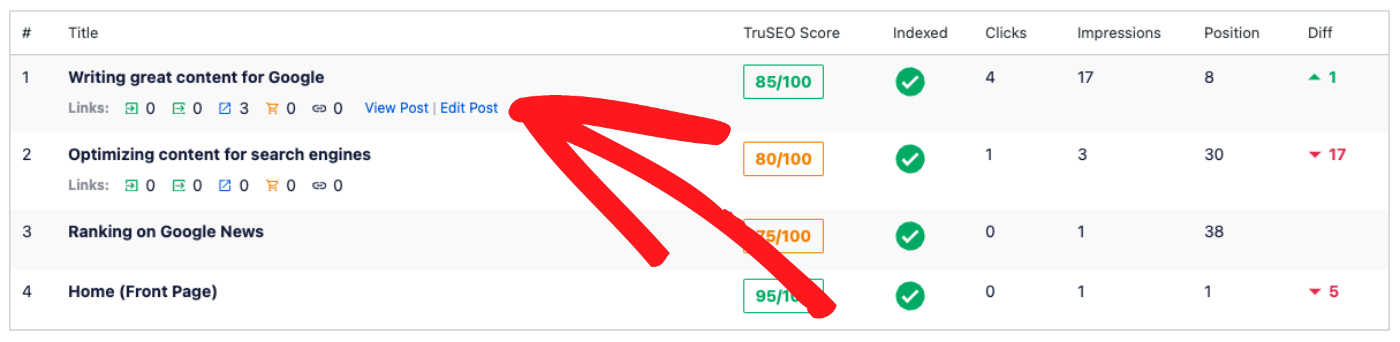
You can mouse over the title of the content to see links to View or Edit the content as shown below:
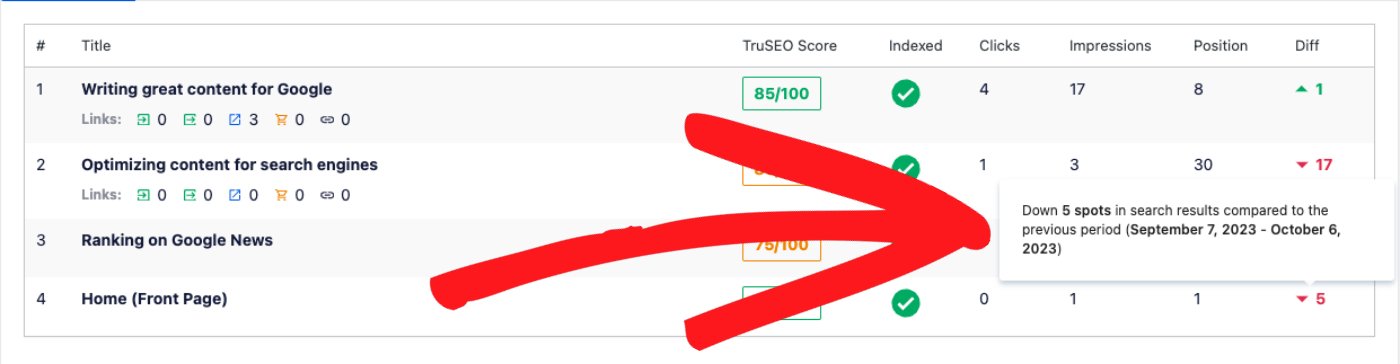
You can mouse over the green or red numbers in the Diff column to see a description of the change as shown below.
Click on the Open Report link to go to the full report on the SEO Statistics tab.
SEO Statistics Reports
The SEO Statistics tab shows the SEO Statistics graph and the Content Performance report.
The SEO Statistics graph shows a larger version of the information displayed in the SEO Statistics widget seen on the Dashboard tab.

You can click on the graph legend below the graph to select which metrics to display in the graph.
You can mouse over the statistics to see more detail.
You can mouse over the graph to see details for that date.
On the bottom row of the graph you'll see a Google icon.
This icon shows whenever Google made changes to their system which may impact rankings.
Click on the Google icon to see the details of the change they made, along with a Read More button which will take you to Google's changelog.
The Content Performance table shows the same information as the Content Performance widget displayed on the Dashboard tab.
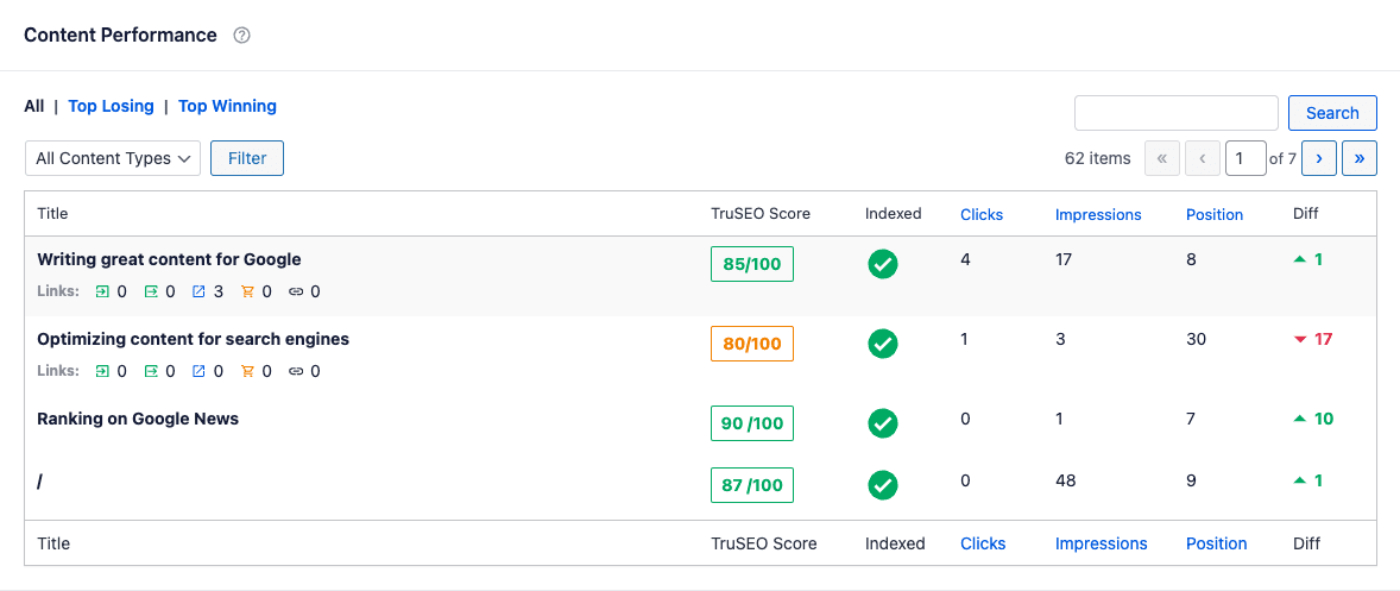
The table is paginated, displaying 10 items of content per page. You can search the table for your content title.
You can click on the Top Losing or Top Winning tabs to see only that content.
Keyword Ranking Tracker
The Keyword Ranking Tracker tracks how your keywords are performing on Google Search. You can learn more about this feature in our Using the Keyword Rank Tracker feature in Search Statistics article.
Content Rankings Reports
The Content Rankings tab shows a detailed report of how your content is performing in Google search results.
By using this report, you can easily spot content decay and identify significant trends.

The Content Rankings report highlights many essential SEO and content marketing metrics, such as:
- TruSEO Score: This is the TruSEO score for your content.
- Indexed: This shows the index status in Google. You can learn about this feature in our Index Status article here.
- Last Updated On: This shows the date that this content was last updated. This helps you easily track the impact of any change you make on a particular page or post.
- Loss: This is how many points were dropped on the last month compared with the all-time high. This is based on our proprietary content decay algorithm, which considers an article’s impressions and clickthrough rates (CTR), among other factors. For example, in January you had 10k points, and in June you had 2k points, your loss will be -8k points, and the drop will be 80%.
- Drop (%): The percentage drop or gain in content decay points. This number is the sum of impressions and clicks.
- Performance Score: This is a visual overview of your content’s performance over the past 12 months. If you see Slowly Recovering under your graph, it's because the Drop (%) is less than 25% and in the last 4 months, the points are consecutively up.
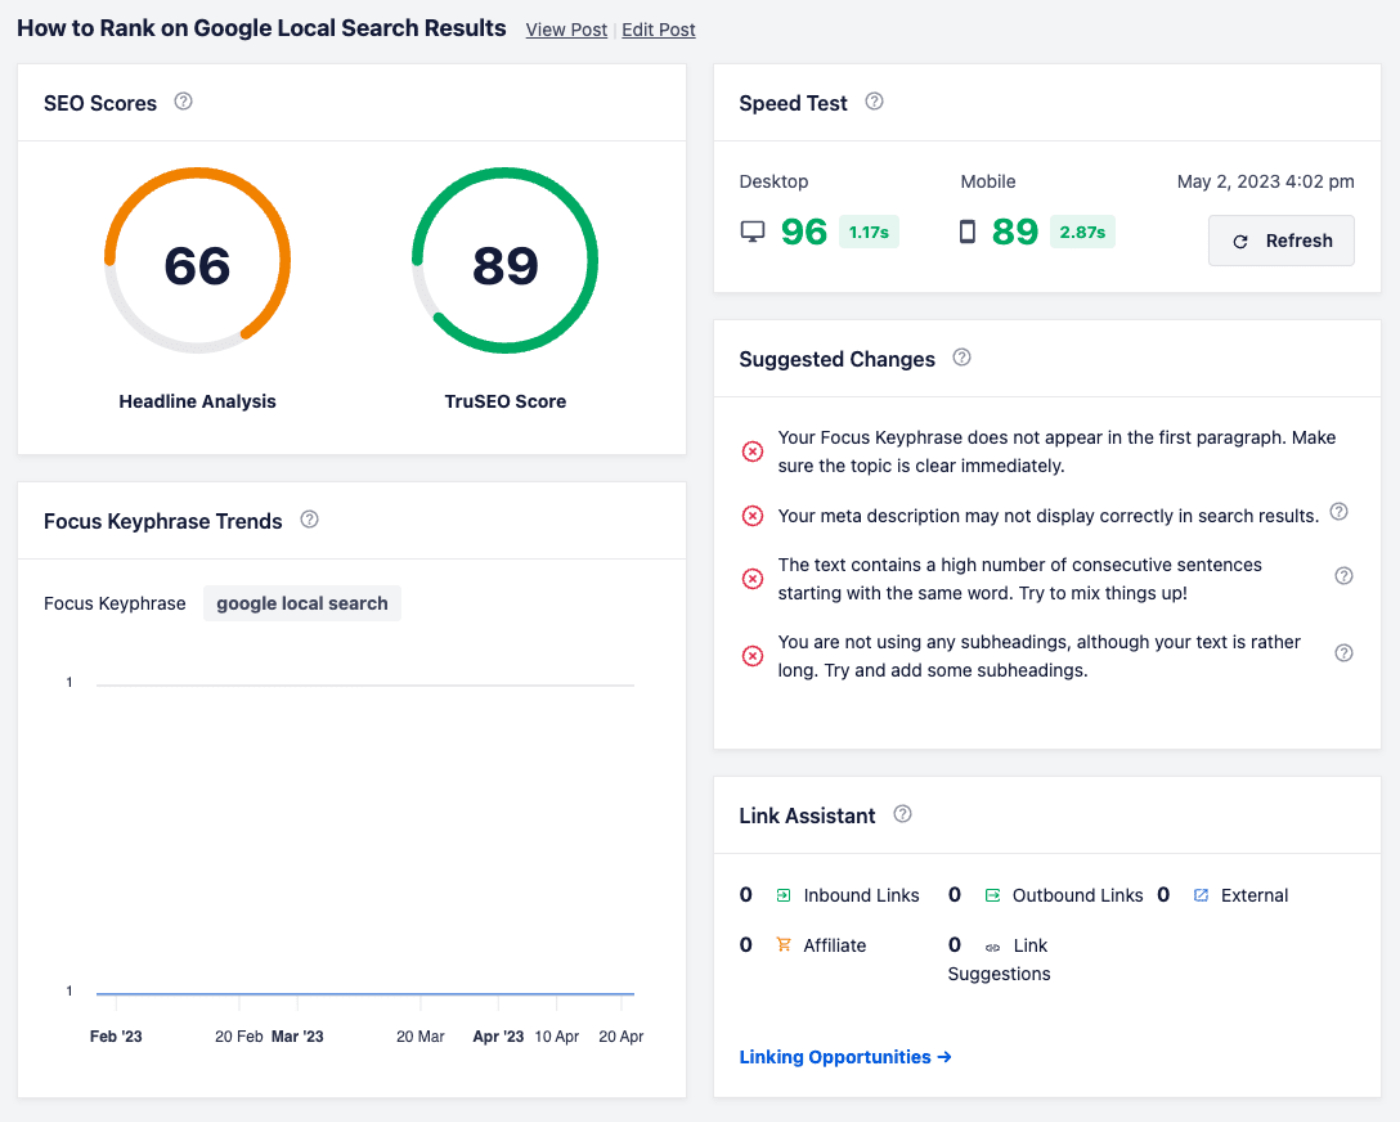
When you click on a page or post in the report, you get detailed SEO data about that content.
You can view the Headline Analysis Score, TrueSEO score, page load speed, and a links report from Link Assistant.
You can also see an overview of the Google Page Indexing, SEO metadata, redirects, and SEO performance.
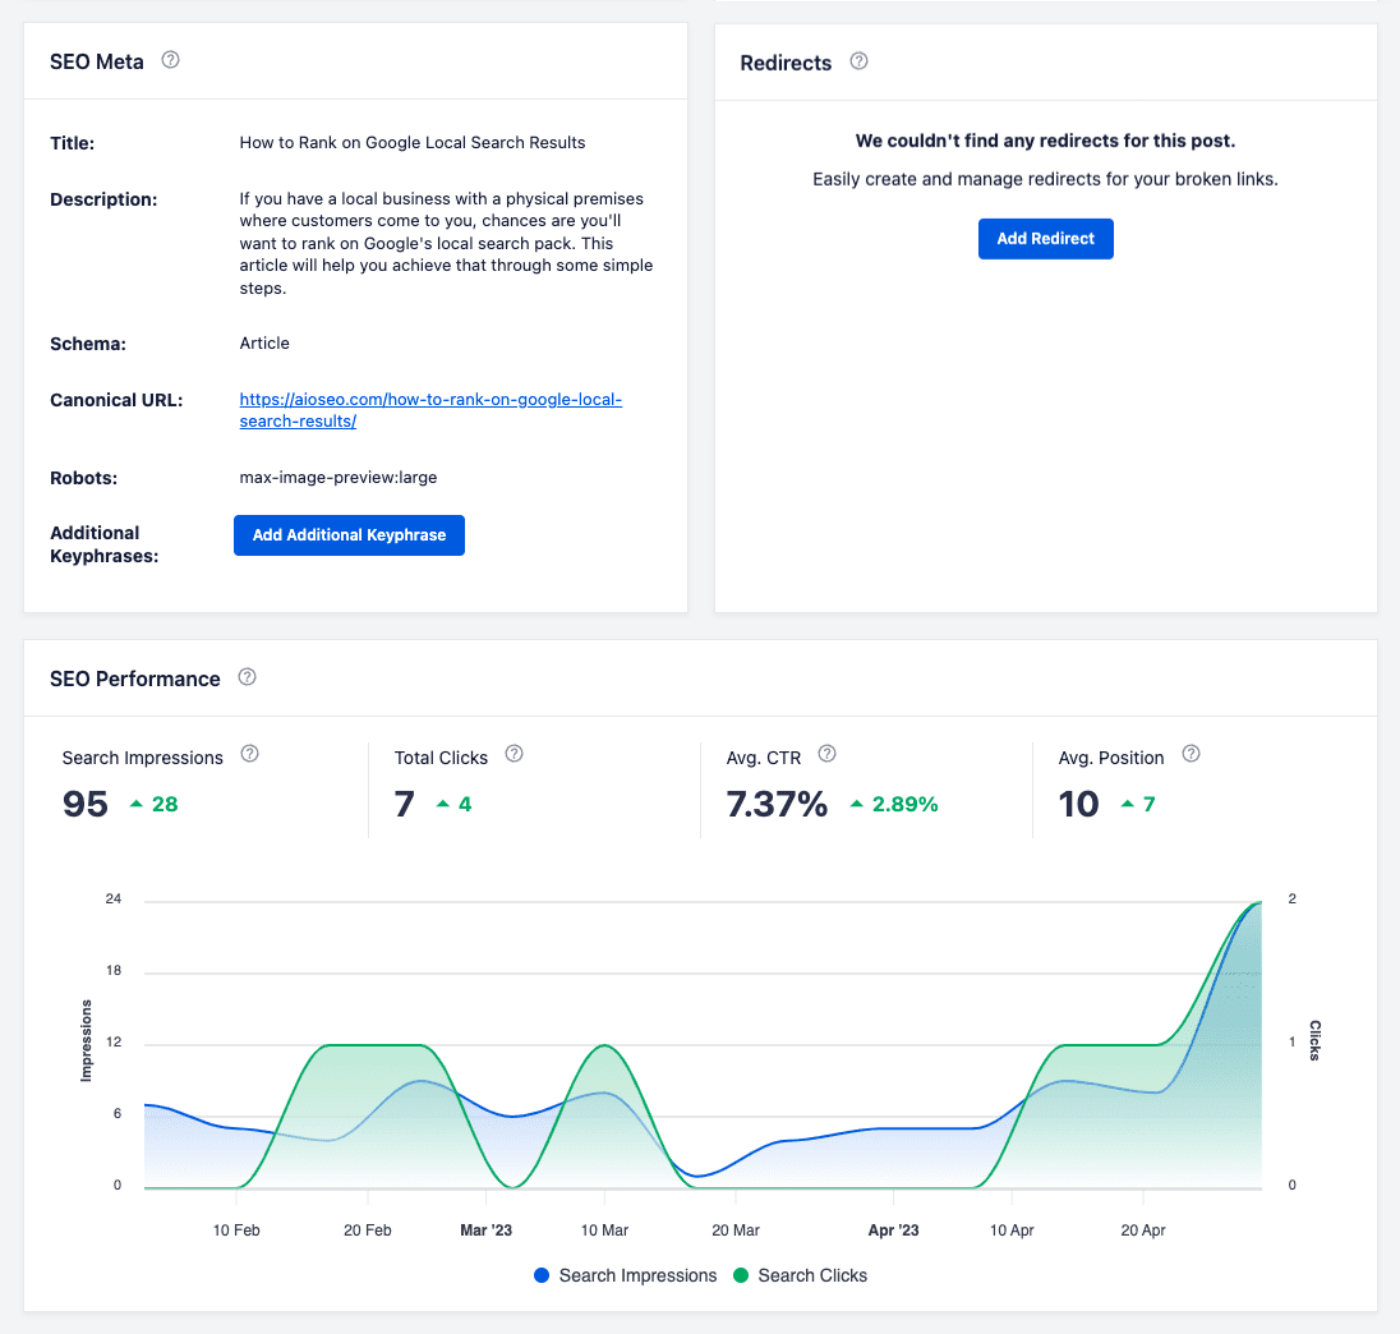
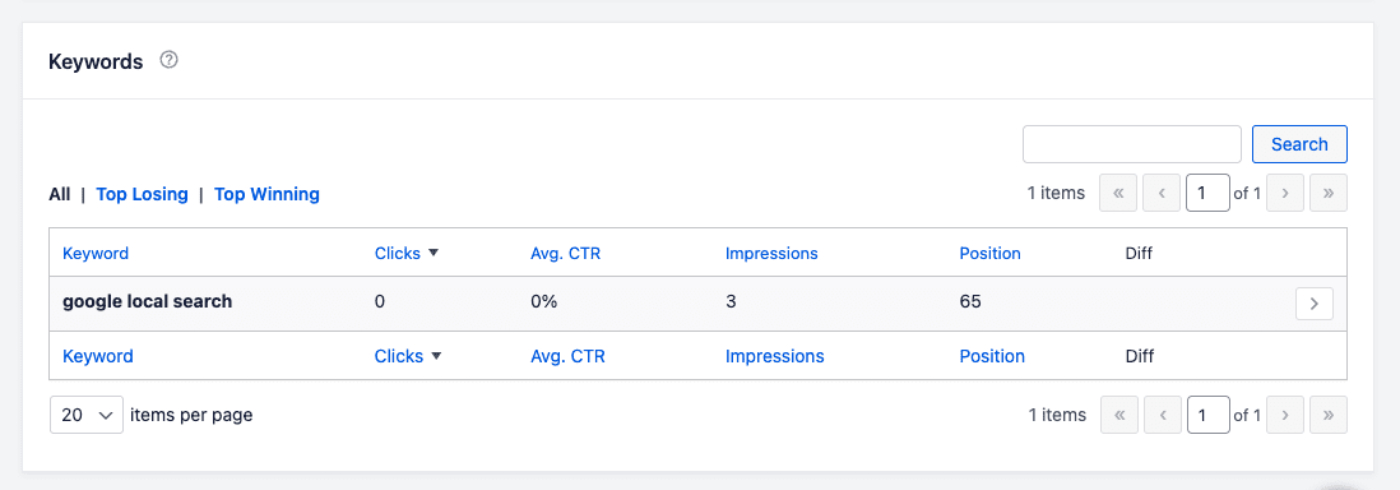
Lastly, there's a Keywords table that shows information about how the keywords for this content are performing.
Detailed Search Statistics Reports
Search Statistics includes the ability to drill down into specific items of content so that you can see detailed statistics.
Click on the title of any post in either the Content Performance table, Keyword Performance table, or Content Ranking table and you’ll be taken to the Search Statistics reports for that post where you’ll see a number of widgets with detailed information about the post.
You can read about these reports in our article on Viewing Detailed Search Statistics For Your Content here.
Search Statistics Settings
Under the Settings tab of Search Statistics you can manage the connection to your Google Search Console account and select which post types you want included in Search Statistics.
You can learn more about the Search Statistics settings here.
Further Reading
Check out more articles on how to use the Search Statistics feature in All in One SEO here.